SCIOPTA Kernel Awareness plug-in
SCIOPTA kernel awareness plug-in provides enhanced kernel awareness with features including a snapshot of the task-switching and resource states, and the ability to check the stack usage of each task. There are various different plug-ins for SCIOPTA (IAR, Lauterbach and Visual Studio.).
The kernel awareness plug-in includes the display of processes, modules, pools and other SCIOPTA objects. So all that is necessary to get a picture of what is going on while an application runs on a target system. It helps the user to measure stack load, investigate system status and to detect unreleased messages within the SCIOPTA message pool.
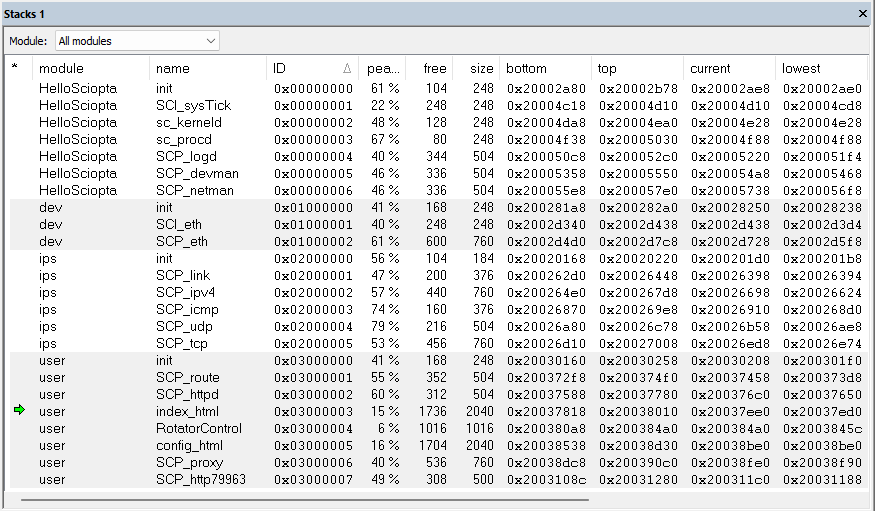
Stack window allows listing all module and processes.
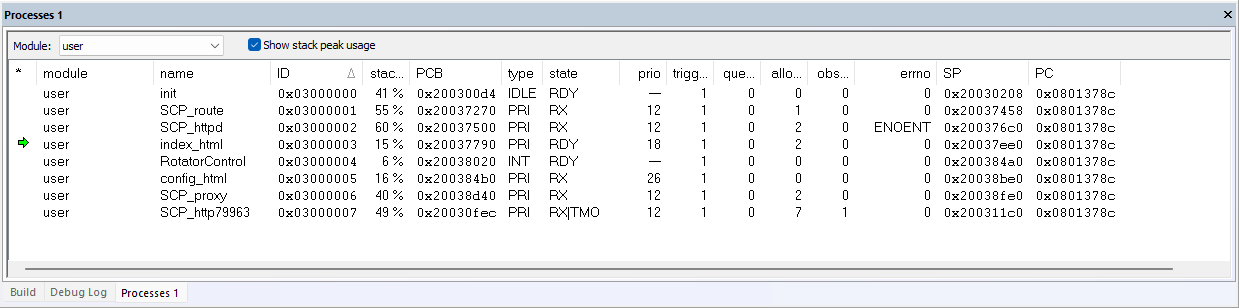
Processes window allows listing all processes.
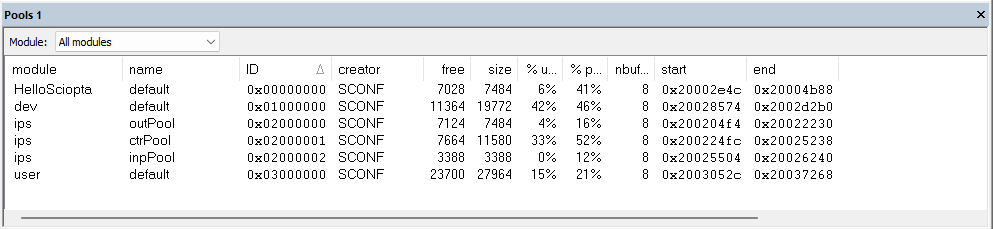
Pools window allows displaying list of pools.
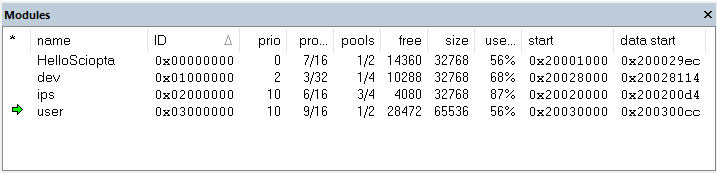
Modules window allows inspecting modules.
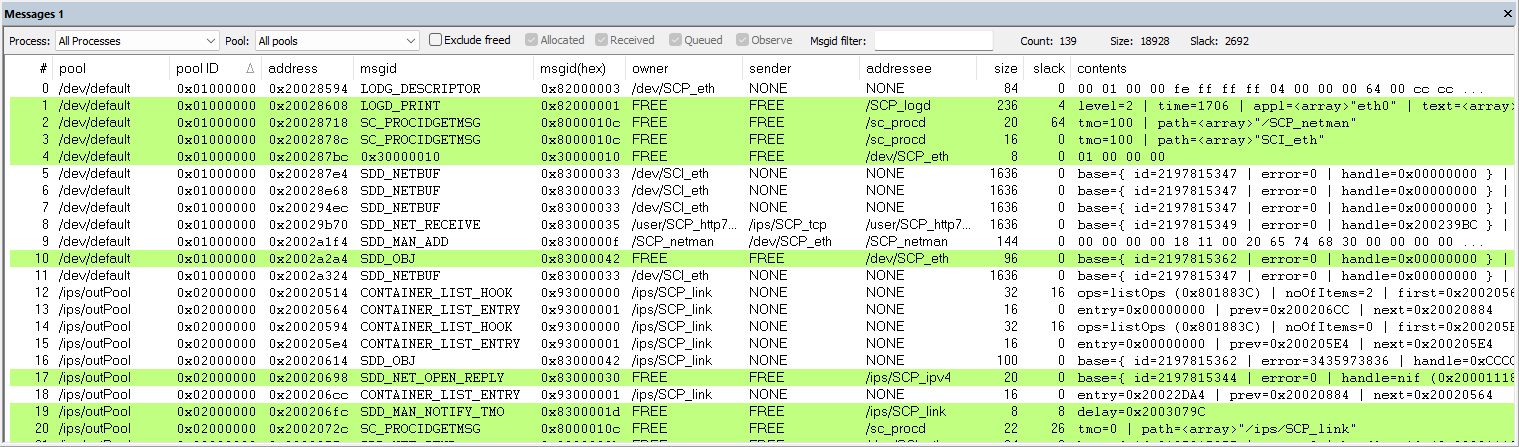
Messages window allows filtering by pool, type, owner, sender and addressee of the message.
System Level Debugging
SCIOPTA DRUID is a debugger on system level and is used in addition to a source-lever debugger. It is not replacing the source-level debugger as DRUID gives you another view into a SCIOPTA system on a higher level.
System level debugging with DRUID allows the user to get module and process information, analyse message pools, trace SCIOPTA messages and other kernel events, set watch- and breakpoints on system events and to get other system information from the target system.
DRUID connects to the target system over a separate channel which can be a simple serial line, a TCP/IP Ethernet link, a USB interface or a transparent channel of the source-level debugger.
Display Module
Processes can be grouped in SCIOPTA modules, which allows you to design a very modular system.
Module status and information can be displayed in DRUID showing information about the number of processes and message pools and module memory map.
Message Trace
Message trace is a strong feature of DRUID. The user can configure target memory to be reserved for message trace. You can setup trace-start and trace-stop conditions and DRUID will trace selected messages between start and stop.
There is a Trace Option List where the user defines what messages to trace. For a receiver or a sender the module or process can be defined. The message ID can be given as a further option.
Display Processes
Information about processes in each module can be displayed. This includes address of the PCB (process control block), name, ID, type, state and priority of the processes.
Also information about the stack of all processes is available. Number of bytes of ever used stack, the addresses of the stack, size and the stack pointer are shown.
Running Modes
DRUID can be used when the target system is stopped or even in running target systems.
Display Message Pool
SCIOPTA messages are maintained and managed in message pools. There can be up to 128 pools per module.
DRUID allows to display important information of each message pool. This includes name, pool ID, creator process, start address, pool pointer address, size and unused memory of the pool.
You can also display information about the messages in a specific pool. This includes status, address, message ID, owner, sender, receiver, size and content of all messages in a pool.